Displaying Data
6th grade | 6.SP.B.4 | 1 minute, 8 seconds
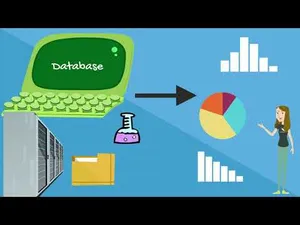
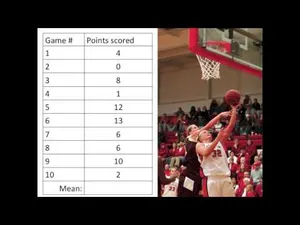
In this framing video, 6th graders are introduced to the concept of charting data in dot plots, box plots, and histograms.
Share with your students
Unlock this activity and thousands more in eSpark’s playfully personalized learning environment.
What's popular right now
Related Activities
Try Now 
video
Summarize Sets of Data
Summarizing Data Sets
6.SP.B.5.a and 3 more
Try Now 
video
Intro to Data
Center, Spread and Shape
6.SP.A.2
Try Now 
video
Intro to Statistical Questions
Intro to Statistics
6.SP.A.1
Try Now 
video
Measures of Center Framing Video
Measures of Center and Variation
6.SP.A.3


